
Thursday, 25 October 2012
AAPL update - Earnings release
$AAPL just released their q3 earnings with a miss. The stock is currently halted, but judging by the nasdaq futures, currently - 40, it will open at or around the short target. If I were short appl based on the info in the previous posts i would cover right here, as soon as trading resumes.
 Job done.
Friday, 19 October 2012
$aapl update
Further to my previous posts on Apple back in August and a few weeks ago, the apple stock has closed today at -$22 or -3.5%. The stock is rapidly closing in on the support levels noted in the previous post. As you can see from the chart below, the stock tested and retested the neckline and is now trading down to the support levels.
This stock has been in a parabolic move for previous months and has been overdue a correction. To put this correction into context we are currently less than 15% from the highs and still trading above the 200 day moving average, For aapl bulls who are nervously holding here, pullbacks to the 200 daily moving average are normal and indeed healthy. The stock is still in a up trend and it is high probability buyers will come in at the support levels. Disclosure, I have no position in $aapl.
Tuesday, 9 October 2012
$aapl Head and Shoulder's
Further to the previous post on apple, we can now see a classic topping pattern formed on this stock.

As you can see this targets around $600. The rising purple line is the 200 simple moving average. The stock has been above this average for roughtly a year, so overdue to pullback.

As you can see this targets around $600. The rising purple line is the 200 simple moving average. The stock has been above this average for roughtly a year, so overdue to pullback.
Saturday, 29 September 2012
Nassim Nicholas Taleb (Black Swan) video
Below is a classic video from Taleb. It's over 10 years old, broadcast before the black swan book. He talks about his first book "fooled by randomness", which in my opinion is better than the black swan. Amazing insight and very relevant to today's markets.
A recommended watch.
A recommended watch.
Friday, 21 September 2012
More Ray Dalio Video's, Bridgewater Associates
Following on from the recent Ray Dalio Video, below are links from todays CNBC.
On China - http://video.cnbc.com/gallery/?video=3000117548&play=1
On QE3 - http://video.cnbc.com/gallery/?video=3000117549&play=1
On Europe - http://www.cnbc.com/id/15840232/?video=3000117552&play=1
Rules on Investing - http://www.cnbc.com/id/15840232/?video=3000117531&play=1
On Gold - http://www.cnbc.com/id/15840232/?video=3000117541&play=1
Worth a watch.
Friday, 14 September 2012
Ray Dalio video, Bridgewater Associates
This is well worth a watch, for a excellent analysis of the fundamentals.
Such clarity of thought, from one of the most successful hedge fund managers around.
Such clarity of thought, from one of the most successful hedge fund managers around.
Sunday, 19 August 2012
Contrarian Apple indicator
$aapl made another all time high on Friday. The below headline is currently showing on CNBC website.

"why Apple will soar 40% to $900". Putting aside any fundamential views, anyone trading tech stocks in the late 90 will know this sort of hype was typical towards the end of the bull move. This time may be different, but from a contarian investing perspective this sort of headline should worry the $aapl bulls.

"why Apple will soar 40% to $900". Putting aside any fundamential views, anyone trading tech stocks in the late 90 will know this sort of hype was typical towards the end of the bull move. This time may be different, but from a contarian investing perspective this sort of headline should worry the $aapl bulls.
Monday, 25 June 2012
Latest from Soros on Euro crisis.
Some good analysis just out from George Soros, re the Euro crisis.
Watch the video here. Over 40 mins long, but worth the watch
Watch the video here. Over 40 mins long, but worth the watch
Wednesday, 9 May 2012
Trading ES down gaps after 15 day low close.
The ES emini contract is currently trading down 13 points. Yesterday the $spx closed at a multiday low. Below is a equity curve of a strategy that fades down gaps when the previous day closed at a 15 day low. The strategy exits at gap fill or at end of day.

As you can see this would suggest a decent historic edge. Again, please note this set-up does not include factors such as seasonality, trend, gap size average drawdown etc, other factors that need to be considered. Please trade at your own risk.
Saturday, 28 April 2012
Friday, 20 April 2012
ES - This weeks unique price action
The ES contract closed for the week at 1375.25, up 10.25 points on the week, with a weekly range of 30.75 points. A normal sounding week, however the daily bars have produced an interesting pattern. Below are the daily bars of the 24hr ES market.

Tuesday was a outside bar, wed was an inside bar, thurs was an outside bar and today another inside bar. By my calculations this is the first time this has happened since the ES contract was established in 1997. This may well turn out be be of little significance, but from my experience, when the market does things it hasn't done before (or has rarely done before) that's an important message and a good time to play extra defensive.
All eyes on the Fed next week.
Monday, 16 April 2012
Upgaps following an unfilled down gap and unfilled up gap.
Today we are trading up over 9 points. On Friday there was an unfilled down gap. On Thursday the up gap was also unfilled. Below is an equity curve of a strategy that fades up gaps following such action, 1 contract with the stop at end of day or gap fill.

As you can see this has happened 46 time over the last 12 years, with 36 or 84% either filling gap or closing in profit.
Again, please note this set-up does not include factors such as seasonality, trend, average drawdown etc, other factors that need to be considered.
As you can see this has happened 46 time over the last 12 years, with 36 or 84% either filling gap or closing in profit.
Again, please note this set-up does not include factors such as seasonality, trend, average drawdown etc, other factors that need to be considered.
Sunday, 15 April 2012
More from Soros, on Euro and reflexivity.
Following on from yesterday's video featuring George Soros, below is an hour long speech from Soros on reflexivity and the Euro crisis. A fascinating insight and highly recommended.
From April 2012, New Economic Thinking (INET) Paradigm Lost Conference at the Foreign Ministry in Berlin.
From April 2012, New Economic Thinking (INET) Paradigm Lost Conference at the Foreign Ministry in Berlin.
Saturday, 14 April 2012
Soros on Europe
Some excellent insight from George Soros on Euro crisis.
Thanks to zerohedge.com for spotting this video. From April 13th, 2012.
Thanks to zerohedge.com for spotting this video. From April 13th, 2012.
Friday, 13 April 2012
Down gaps after strong rally day
The ES emini futures are currently set to gap down. Yesterday the $spx and $indu (Dow Jones) rallied hard, with the Dow closing up over 1.4%. Below is an equity curve of a strategy that goes long any down ES gap when the previous day closes up by over 1 average daily range and leaves an open up gap. The strategy exits at end of day or at gap fill. Based on 1 contract over the last 12 years.
 84.5% of trades either closed the gap or closed up on the trade, which suggests a decent historic upside edge for today’s session. Please note this set-up does note include factors such as seasonality, trend, average drawdown etc, other factors that need to be considered.
Please trade at own risk.
Please trade at own risk.
Thursday, 5 April 2012
Gaps on the trading session before Good Friday.
Tomorrow is Good Friday. Below is a equity curve of a strategy that fades the opening gap, either long or short, over the last 13 years. The strategy exits at gap fill or at end of day.

As you can see, 12/13 have filled.
I would not trade on this sort of seasonal info alone, but a factor to consider in trade analysis. Please trade at own risk.

As you can see, 12/13 have filled.
I would not trade on this sort of seasonal info alone, but a factor to consider in trade analysis. Please trade at own risk.
Monday, 2 April 2012
When 1st of month falls on weekend in a bull market
Today is the first trading day of the month. It has been documented previously here, a historic trading bias on the 1st of the month. Below is an equity curve of a strategy that goes long 1 es contract when the 1st of the month fell on a weekend and in a bull market (my proprietary definition) and exits at the end of the day.

Friday, 30 March 2012
End of Q1. Just like 1987
The S&P cash index rallied from 1258.86 to 1408.47 in the first quarter of 2012, or over 11%. An impressive performance, with many in the financial media comparing the current market structure as similar to gains in Q1 of 1987.
As a reminder of 1987, something to ponder over the weekend.
This is in no way a prediction, just some perspective on how things can change pretty quick.
As a reminder of 1987, something to ponder over the weekend.
This is in no way a prediction, just some perspective on how things can change pretty quick.
Wednesday, 28 March 2012
Bob Prechter. "I got bearish too early, but eventually the piper gets paid"
Latest view from Bob Prechter. Bob, in my opinion, is one of the most knowledgeable guys on the planet with regard to markets. No surprise, he is bearish.
From March 24th 2012.
From March 24th 2012.
Saturday, 24 March 2012
The Predictability of Unpredictability. Taleb
This is excellent. Something to ponder over the weekend.
From Jan 2012
From Jan 2012
Friday, 23 March 2012
Money printing's unintended consequences
Some excellent analysis from Mark Faber.
This was recorded on 17/3/2012.
Monday, 19 March 2012
$spx closes at 200 days highs on 20 day low range
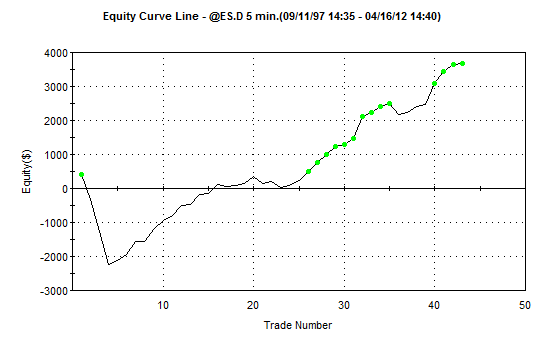
On Friday the S& P 500 futures contract ES closed at another 200 day high. The range was 4.41 for the cash market, $spx, which was also the lowest 200 day range. The instances of this happening are very small, 8 over the last 15 years. To increase the sample size, below is a equity curve of strategy that goes short 1 of es when it closes at a 20 day high with a 20 day lowest range. The strategy exits at the short target, currently 1393, or at end of day.

28/40 or 70% of the trades are profitable, so looks to be a decent edge to be aware of.

28/40 or 70% of the trades are profitable, so looks to be a decent edge to be aware of.
Sunday, 11 March 2012
$70 billion in gold
Ever wondered what $70 billion of gold looked like.
http://video.cnbc.com/gallery/?video=3000077579
From a vault in London, the $gld fund.
http://video.cnbc.com/gallery/?video=3000077579
From a vault in London, the $gld fund.
Friday, 9 March 2012
ES UP gaps on NFP day
Today is NFP day and the ES emini is currently trading up 2 pts. Below is the equity curve of a strategy that goes short 1 contract of ES on any up gap on NFP day and exits at gap fill or end of day.

78% winners, slightly above average.
When the preceding days left an unfilled up gap the figures improved slightly with 8/9 filling by EOD (note small sample size).
Please trade at your own risk. Good luck
Tuesday, 6 March 2012
2 consecutive unfilled down gaps
We are currently trading down 11 es points. For the past 2 sessions we have left 2 unfilled down gaps.
This is a surprisingly rare pattern, which has happened only 11 times over the past 10 years. On all 11 occasions the down gaps closed above the open.
Trade at your own risk. Good luck.
This is a surprisingly rare pattern, which has happened only 11 times over the past 10 years. On all 11 occasions the down gaps closed above the open.
Trade at your own risk. Good luck.
Tuesday, 28 February 2012
When ES closes at 50 day highs after gapping down below previous days low
Yesterday we closed at the highest close for 200 days. What was unusual was that we gapped down below the low of the previous day and reversed to close at the highs.
Below is an equity curve of a strategy that goes short 1 contract of ES at the close of session, when we close at 50 day highs (ive used 50 day to increase sample size) and we gapped below the previous days low. The strategy exits at my 1st short target, currently 1364.25 or at end of day, over the last 12 years.

As you can see this is a rare setup and 10/11 times the next day ES has always traded down to the short target. Note small sample size.
Friday, 17 February 2012
Up gaps on OPEX days
Further to my earlier blog on opex days, here are some numbers on fading up gap on opex day.
85% of ES up gaps have filled by end of day.
88% of ES up gaps on a non quad opex have filled by end of day.
These are both with decent sample sizes. Historically, odds have favoured fading this up move.
85% of ES up gaps have filled by end of day.
88% of ES up gaps on a non quad opex have filled by end of day.
These are both with decent sample sizes. Historically, odds have favoured fading this up move.
$spx closes at 100 day high prior to opex day
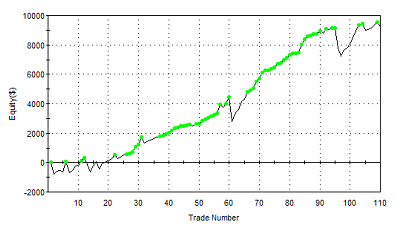
The $spx continued the bullish theme and again yesterday closed at a 100 day highs. Today is February options expiry. Historically when this has happened it has presented an interesting trading opportunity. Below are stats from a strategy that goes short 1 contract of ES when it closes at 20 day highs prior to opex Friday and takes profit at my first ss target, currently at 1351.5, or exit at end of day. I've used 20 day highs to increase the sample size.
A decent edge. Further, below is an equity curve of the same strategy, except it exits at the end of 5 days. This shows the short target was has been hit on every occasion, the max drawdown was never greater than 3 daily average ranges.

80% winners
1.9 Profit factor
$193 average drawdown per contract
$1087 Max drawdown.

So historically, this would suggest that there is a good expectancy ES will trade down to 1351.5 in the next few sessions. Additionally this signal is also currently active.
Friday, 10 February 2012
Down gaps when over 20 consecutive closes above 20 day sma
Following on from this post, on the current run of closes each day of $spx over ma's, I have crunched some numbers looking specifically at down gaps in similar conditions. To keep the sample size large, the below stats goes long all down gaps when es have closed above its 20 day sma for at least 20 consecutive sessions. The strategy exits at gap fill or end of day.
73% winners
1.2 Profit factor
$233 average drawdown per contract
$1,400 Max drawdown.
No great edge here, but what is more interesting is that in these central bank manipulated markets, since 2009 lows, the numbers improve to 78% winners, 1.7% profit factor, with 5/5 in this rally filling by end of the day. We are currently trading down 13 es points, so this size of gap relative to current volatility and other factors need to be taken into consideration.
Wednesday, 8 February 2012
$spx close at 50 day highs and 20 consecutive closes above 20 day ema
Yesterday we closed above the previous days 50 day high and following the theme from yesterday blog we have closed above the 20 day ema for more than 20 consecutive occasions. This is actually the 33rd consecutive session, but I have used 20 in this study to increase the sample size).
Below are some stats of a strategy that goes short 1 contract of es, on the above conditions targeting my first short target, currently 1341 or exit at the end of the day.
77% profitable
1.7 profit factor
73 trades
$189 avg drawdown.

So historically, this would suggest that there is a good expectancy ES will trade down to 1341 at some point in the next 5 days.
Tuesday, 7 February 2012
$SPX & Central Bank intervention
Yesterday $spx closed above its 20 day ema for the 32nd time. We have rallied over 100 points, but to put this move into context with the other rallies since the central banks have been intervening in markets (since 2009 lows) we have had runs of 49, 57, 54 and 50 consecutive sessions where the $spx hasn't traded below its 20 day EMA for more than one session.
Whilst it seems overdone and due for a retrace, the above numbers show these rallies can last longer than expected.
Whilst it seems overdone and due for a retrace, the above numbers show these rallies can last longer than expected.
Wednesday, 1 February 2012
Up gaps on 1st of the month
Today is the first trading day of February. Further to the first of the month bias post, we are now trading well above yesterdays close. Below is a equity curve of a strategy that shorts any up ES gap on the first trading day of the month. The strategy exits at gap fill or end of the day.

As you can see this has been a losing strategy historically. Only 49% of gaps have filled, which is well below historical norms.

As you can see this has been a losing strategy historically. Only 49% of gaps have filled, which is well below historical norms.
Monday, 23 January 2012
Stats on Monday after OPEX
Friday was opex day and we closed up for the 3rd consecutive session, with $spx cash daily range contracting on each occasion. Over the last 10 years this has happened on 16 occasions. on 14 occasions we went on to hit my fist short target (for ES), currently 1304 for todays market, at some point during the next session.
Wednesday, 18 January 2012
100 day high on opex wed
Over the last 10 years the ES emini contract has made 100 day highs on wed of opex week on 18 occasions. For the next session, the ES contract traded down to my first target, equivilant to 1300 in todays market, on 14/18 times. The target was hit on 18/18 times over a 5 day period.
Good luck with any trades tomorrow.
Good luck with any trades tomorrow.
1000 views on Collective2
It took 15 months, 91 trades, 83.5% profitable, 1.9 profit factor, peak to trough drawdown of 6.3%, 25% annual return, but finally got 1000 views on collective2.
 Tough crowd :)
Any questions, please feel free to ask.
Any questions, please feel free to ask.
Subscribe to:
Posts (Atom)